This guide will help you understand the Ratings Dashboard layout, navigate through the different sections, and customise your view to get the most relevant data at your fingertips.
Contents:
- Logging onto the dashboard
- An overview of the layout
- Snapshot and using quick filters
- Customising your view
- Zooming in on a brand's rating
- Tracking changes to rating data
- Inviting brands to Good Measures and tracking their progress
- Exporting your view as a report
- Managing your account and inviting additional team members
Logging onto the dashboard
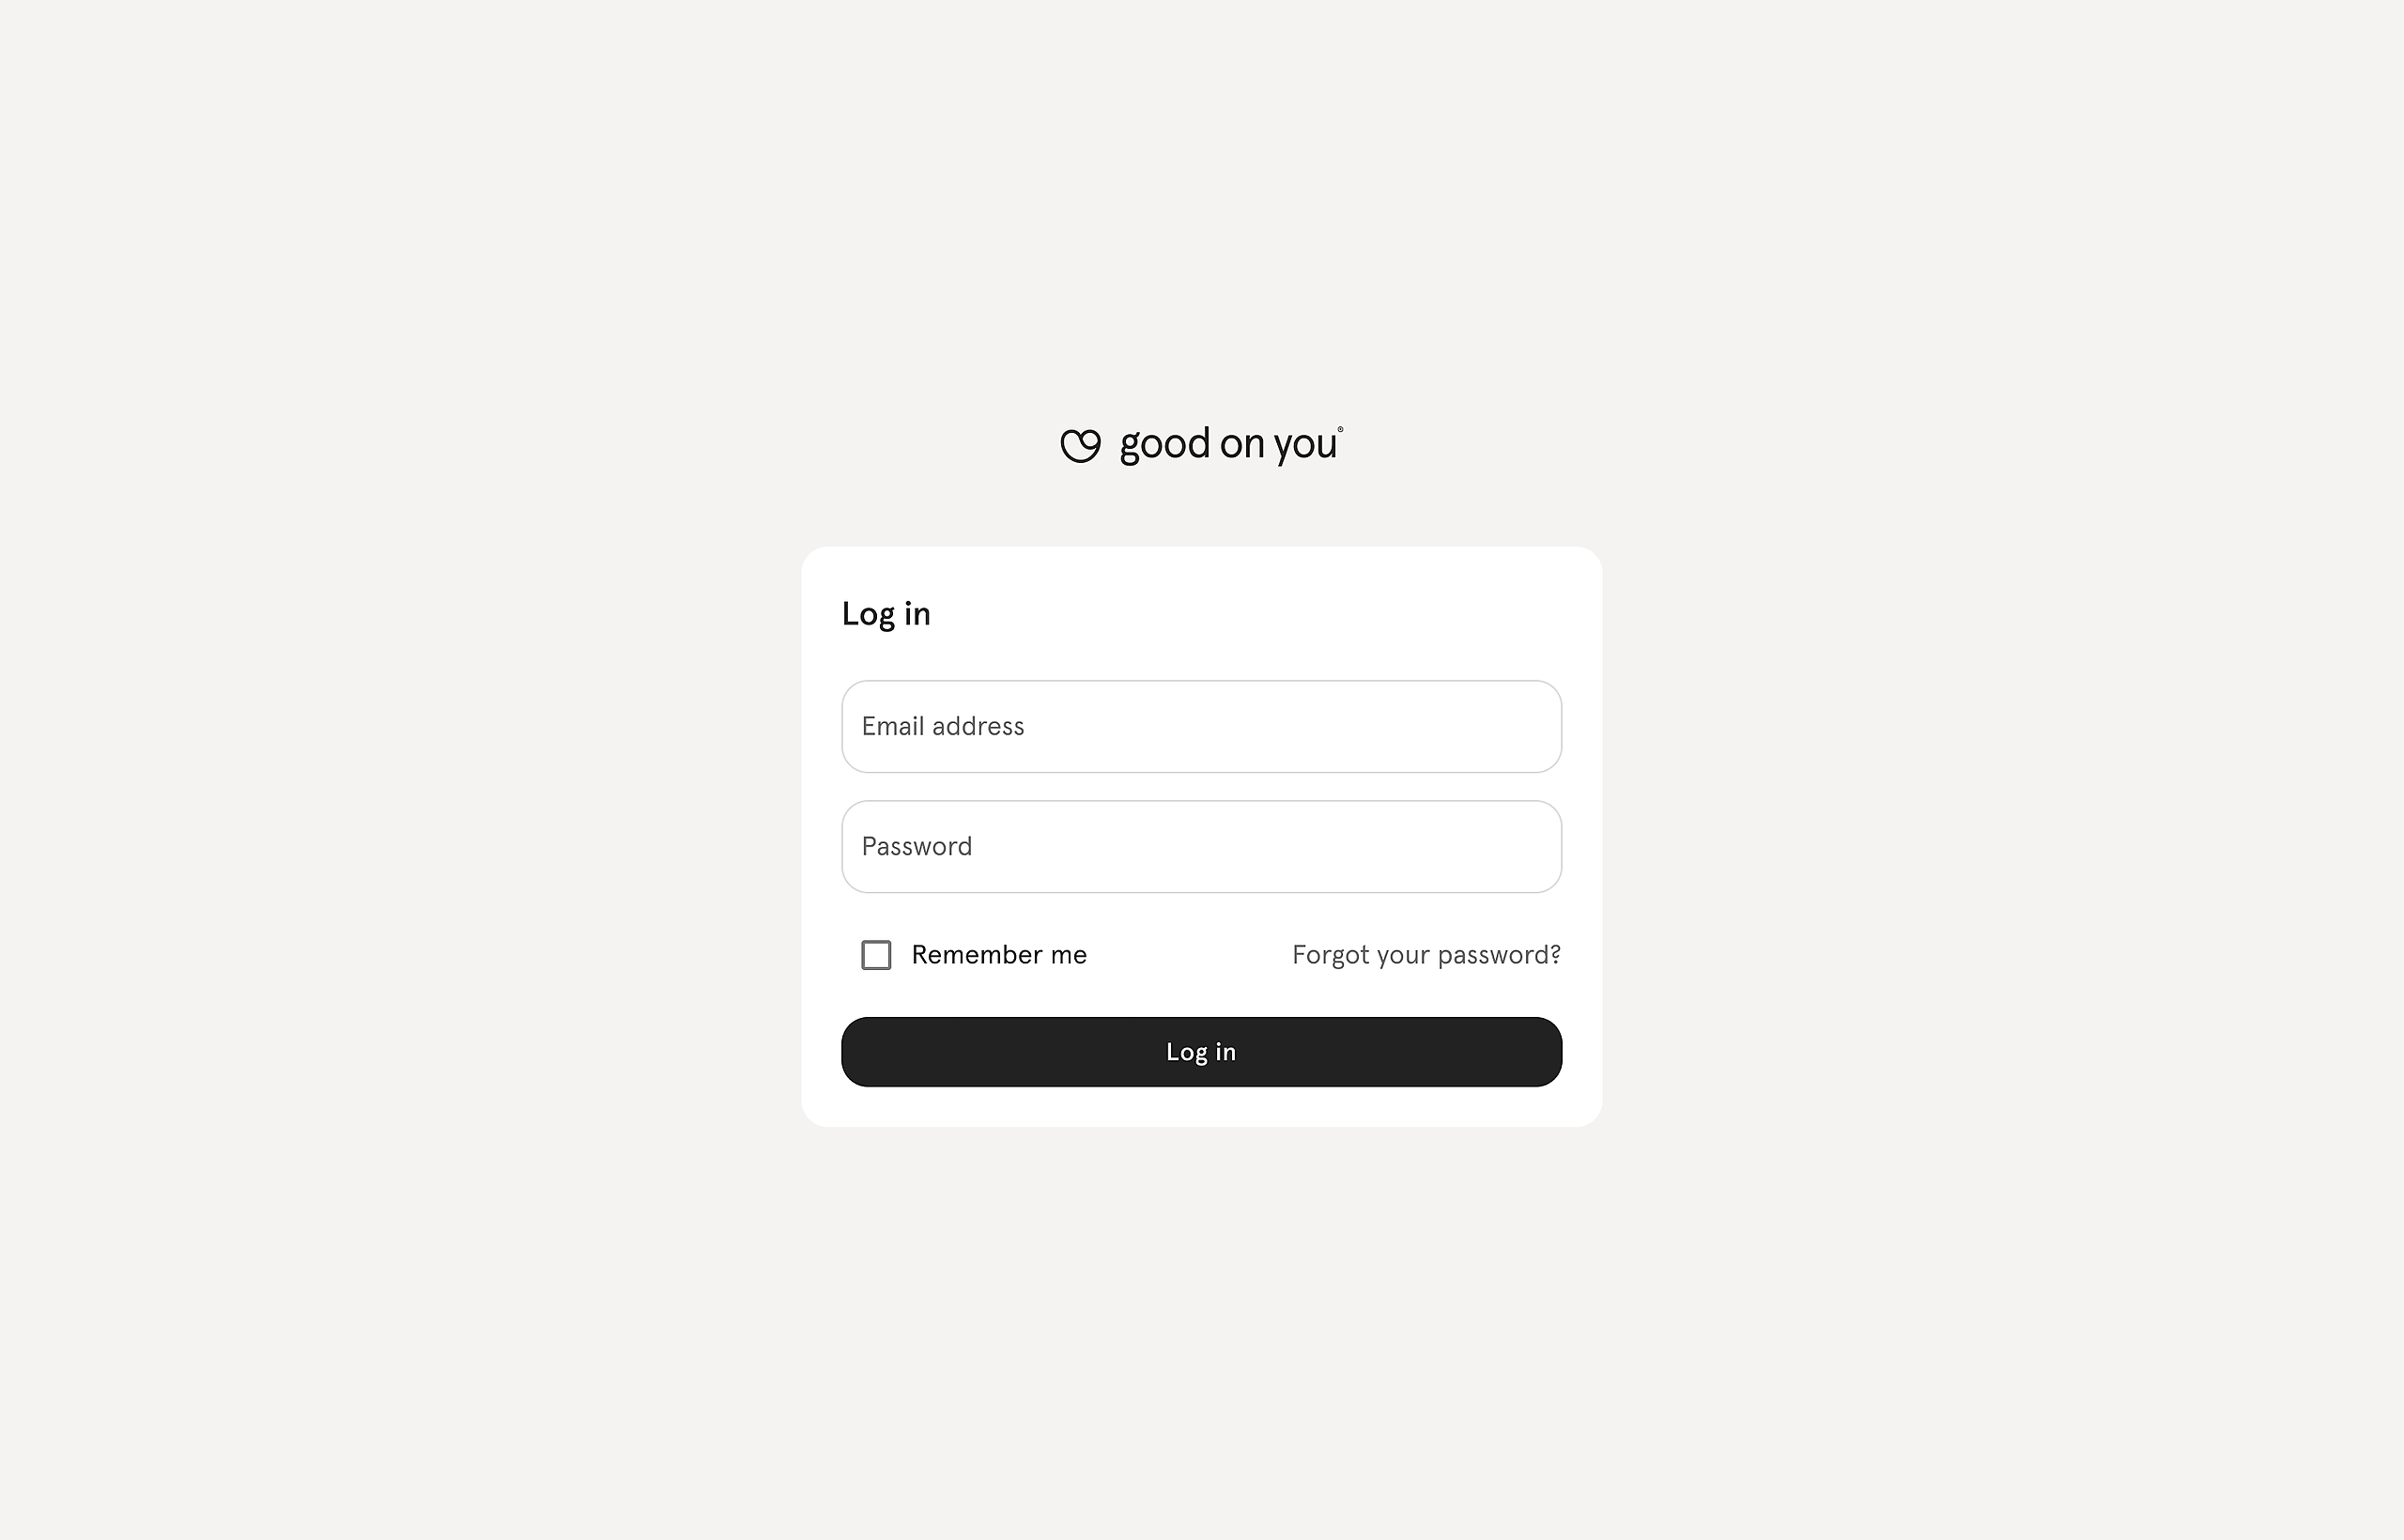
To access the dashboard, go to the login page and enter the credentials provided by your account manager. When prompted to give Good On You Dashboard access to your account, click 'Continue Login’ to proceed to the dashboard.
If you subscribe to Good Measures, you can access it through the dashboard as well. If you forget your password, click "Forgot your password?" to reset it.
An overview of the layout
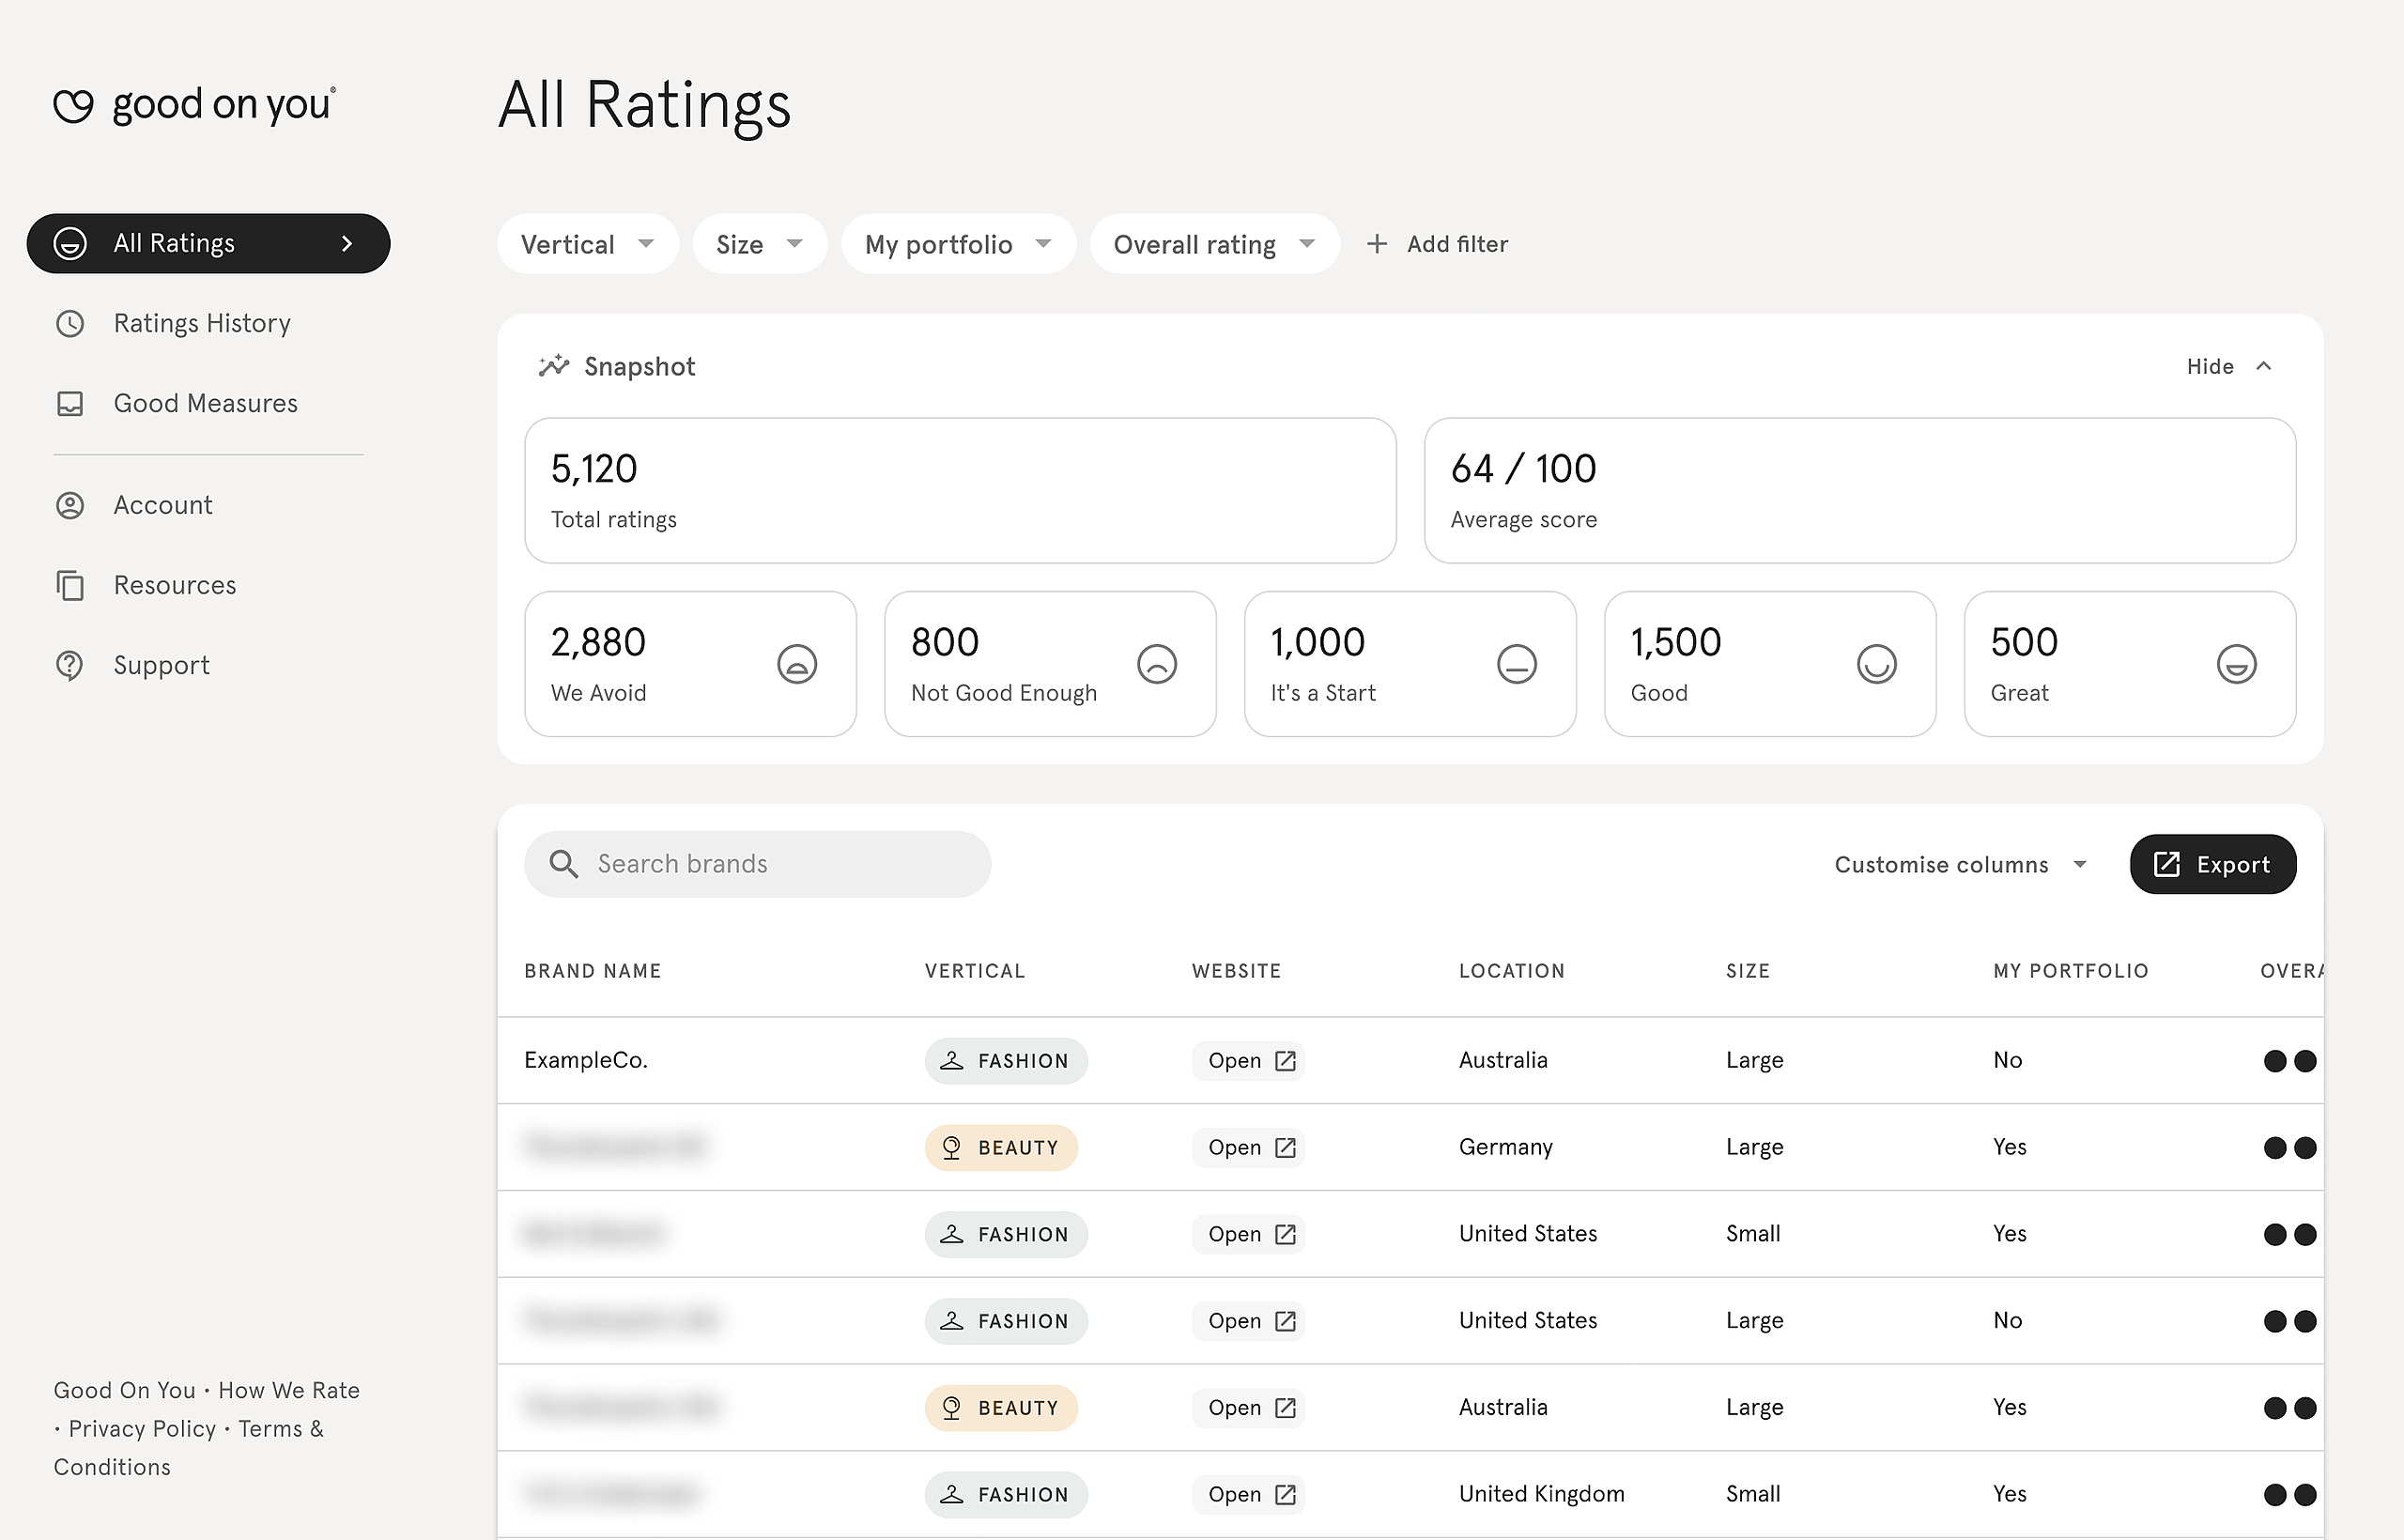
The dashboard has three key sections - All Ratings, Ratings History, and Good Measures. When you log in, the dashboard will default to the All Ratings section. The page layout is the same for all sections, and consists of:
- Snapshot: Found at the top of a section’s page, it provides a quick summary of key data points, which updates as you apply filters.
- Main table of ratings data: Found under the Snapshot, this table contains detailed information on brand ratings.
The navigation panel on the left side of the screen allows you to easily switch between different sections:
- All Ratings (default): A comprehensive view of all brand ratings.
- Rating History: Track historical performance and rating changes over time.
- Good Measures: Invite brands to Good Measures and monitor their submissions. Learn how to invite brands to Good Measures.
- Account: Manage your profile, and if you’re team owner, add new or manage existing members. Learn how to manage your dashboard account.
- Resources: Access helpful guides and additional support materials.
- Support: Contact our support team for further assistance at support@goodonyou.eco.
Note: If Ratings History or Good Measures appear greyed out, it means they're currently not part of your plan. To gain access, contact your account manager for more information.
Snapshot and using quick filters
At the top of each section, you’ll see the Snapshot table. This gives you a high-level summary of key insights from the data, so you can get a quick overview without digging into every detail. The Snapshot adjusts as you apply filters, providing a dynamic view of the data.
Here’s how to adjust your view using quick filters:
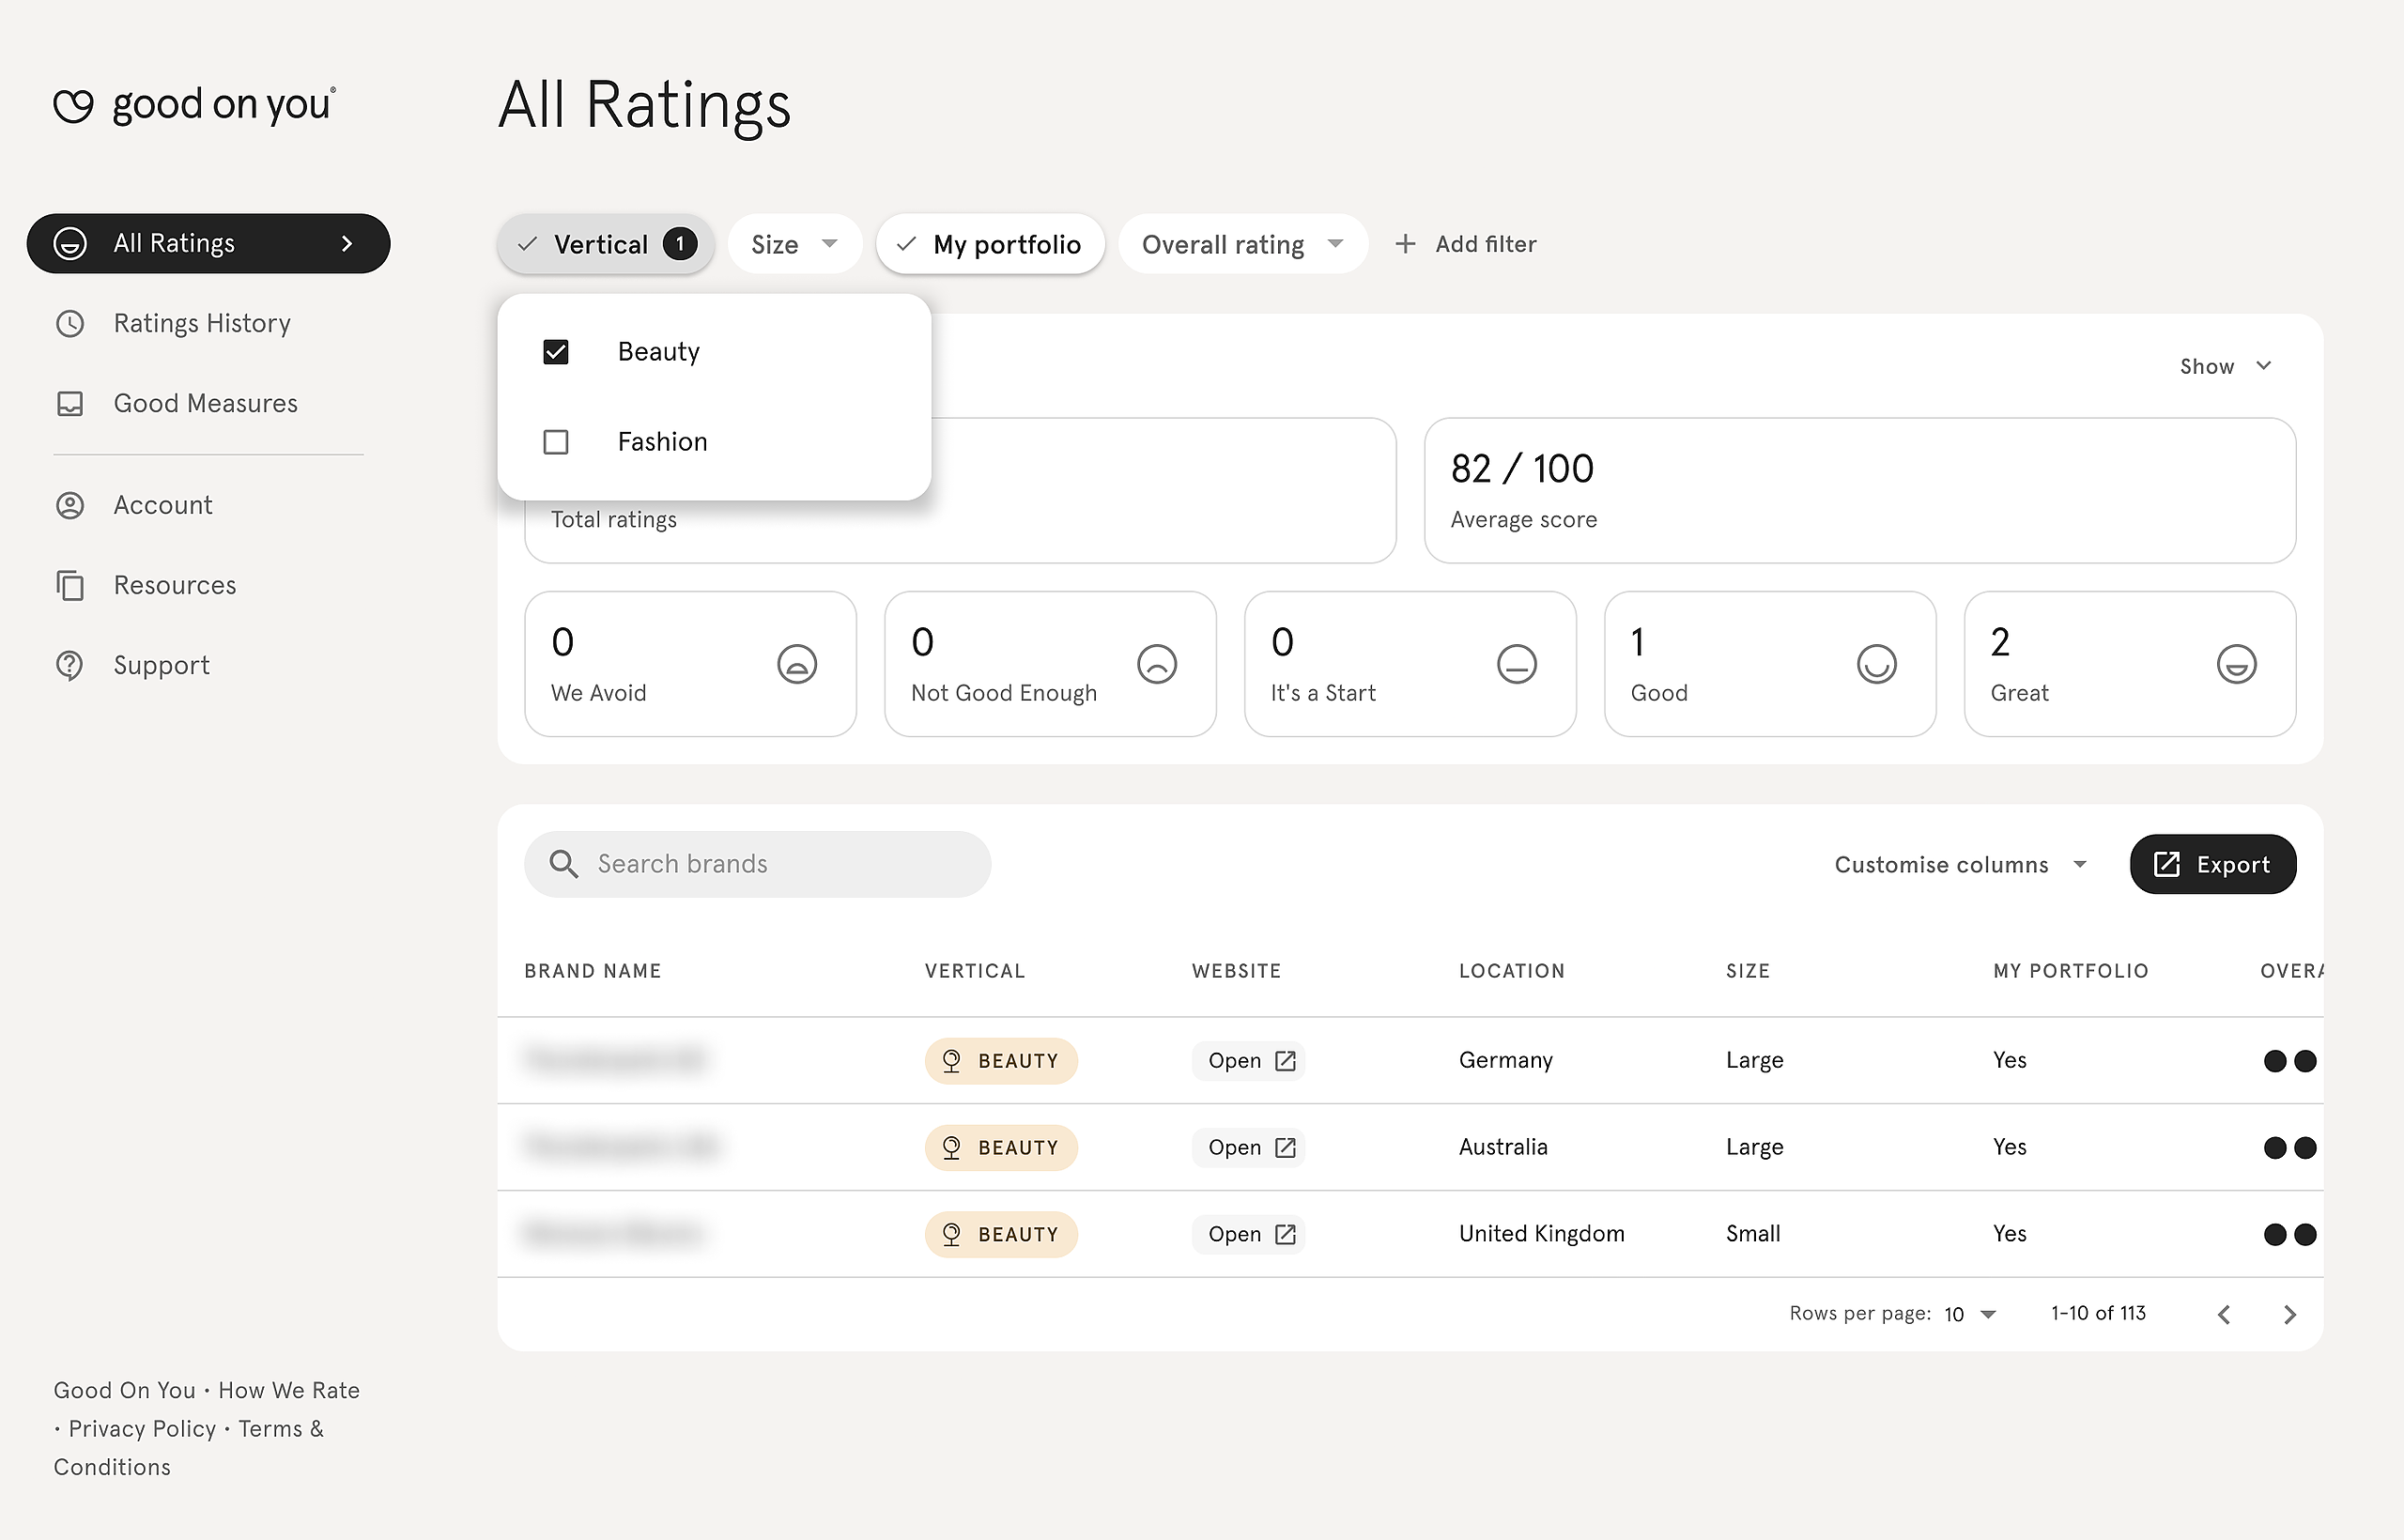
- Select filters: Click on the Add filter button, found above the Snapshot, to open a list of data points, The Snapshot and main data table will automatically update to reflect your chosen filters.
- Clear all filters: Click on the Reset button, also found above the Snapshot, to remove all applied filters.
You can filter by various data properties, and default filters include:
- Industry sector, such as fashion or beauty (“Vertical”)
- Size or geographical location.
- Rating (“Overall”, “Planet”, “People”, “Animals”)
- Brands in your portfolio (“My Portfolio”)
Customising your view
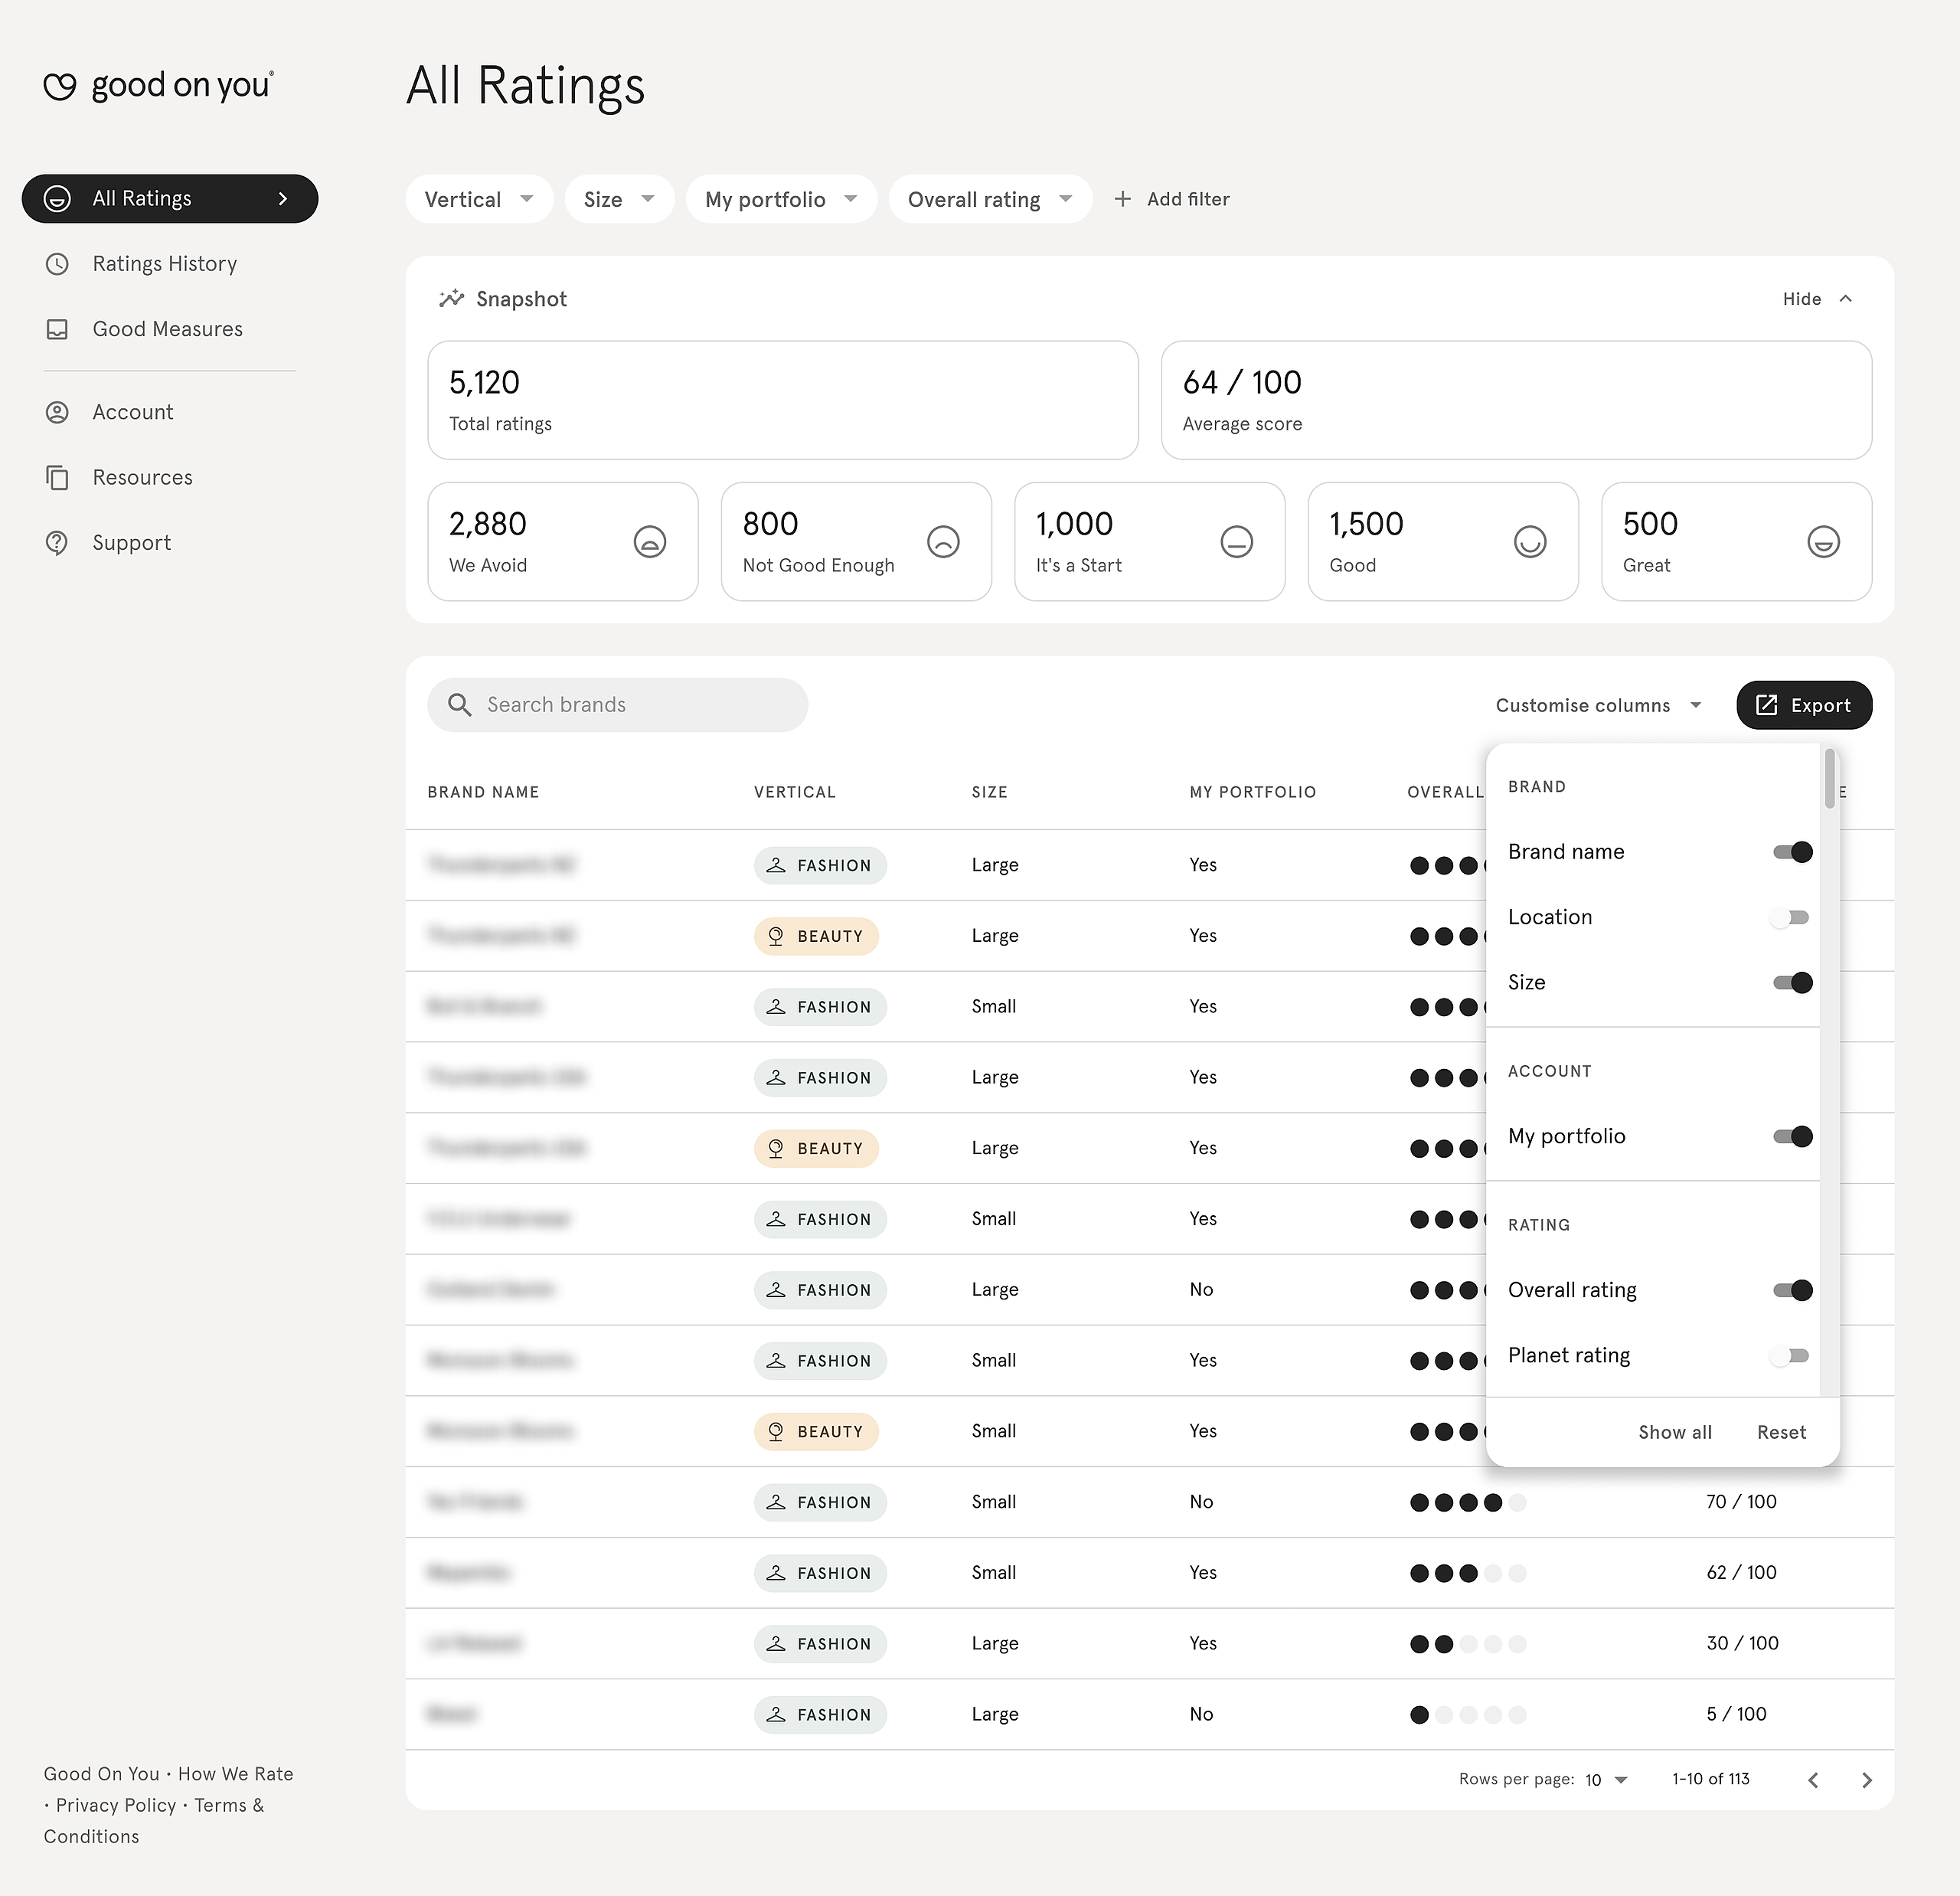
You can customise the data table to focus on the information most relevant to you.
- Click ‘Customise columns’ to select data: Look for the Customise columns button at the top-right of the data table. Clicking it will open a list of data points, allowing you to toggle them on or off based on what you want to see in the table. You can also select ‘Show all’ to display all available data points. If you want to revert to the original view, click the Reset button.
- Click on column headers to sort data: You can sort the data by clicking on any column header. This will organise the data in ascending or descending order. For example, sorting by 'Overall Rating' will show you the high or low performing brands first.
'My Portfolio' feature
If you have access to the My Portfolio feature, you can also customise your view to focus solely on brands in your portfolio. Click on the Customise columns button, select ‘My Portfolio’ from the list of data points, and the table will automatically update to display only the brands in your portfolio.
If the My Portfolio feature is not visible, it means it's not included in your plan. To gain access, contact your account manager.
Zooming in on a brand's rating
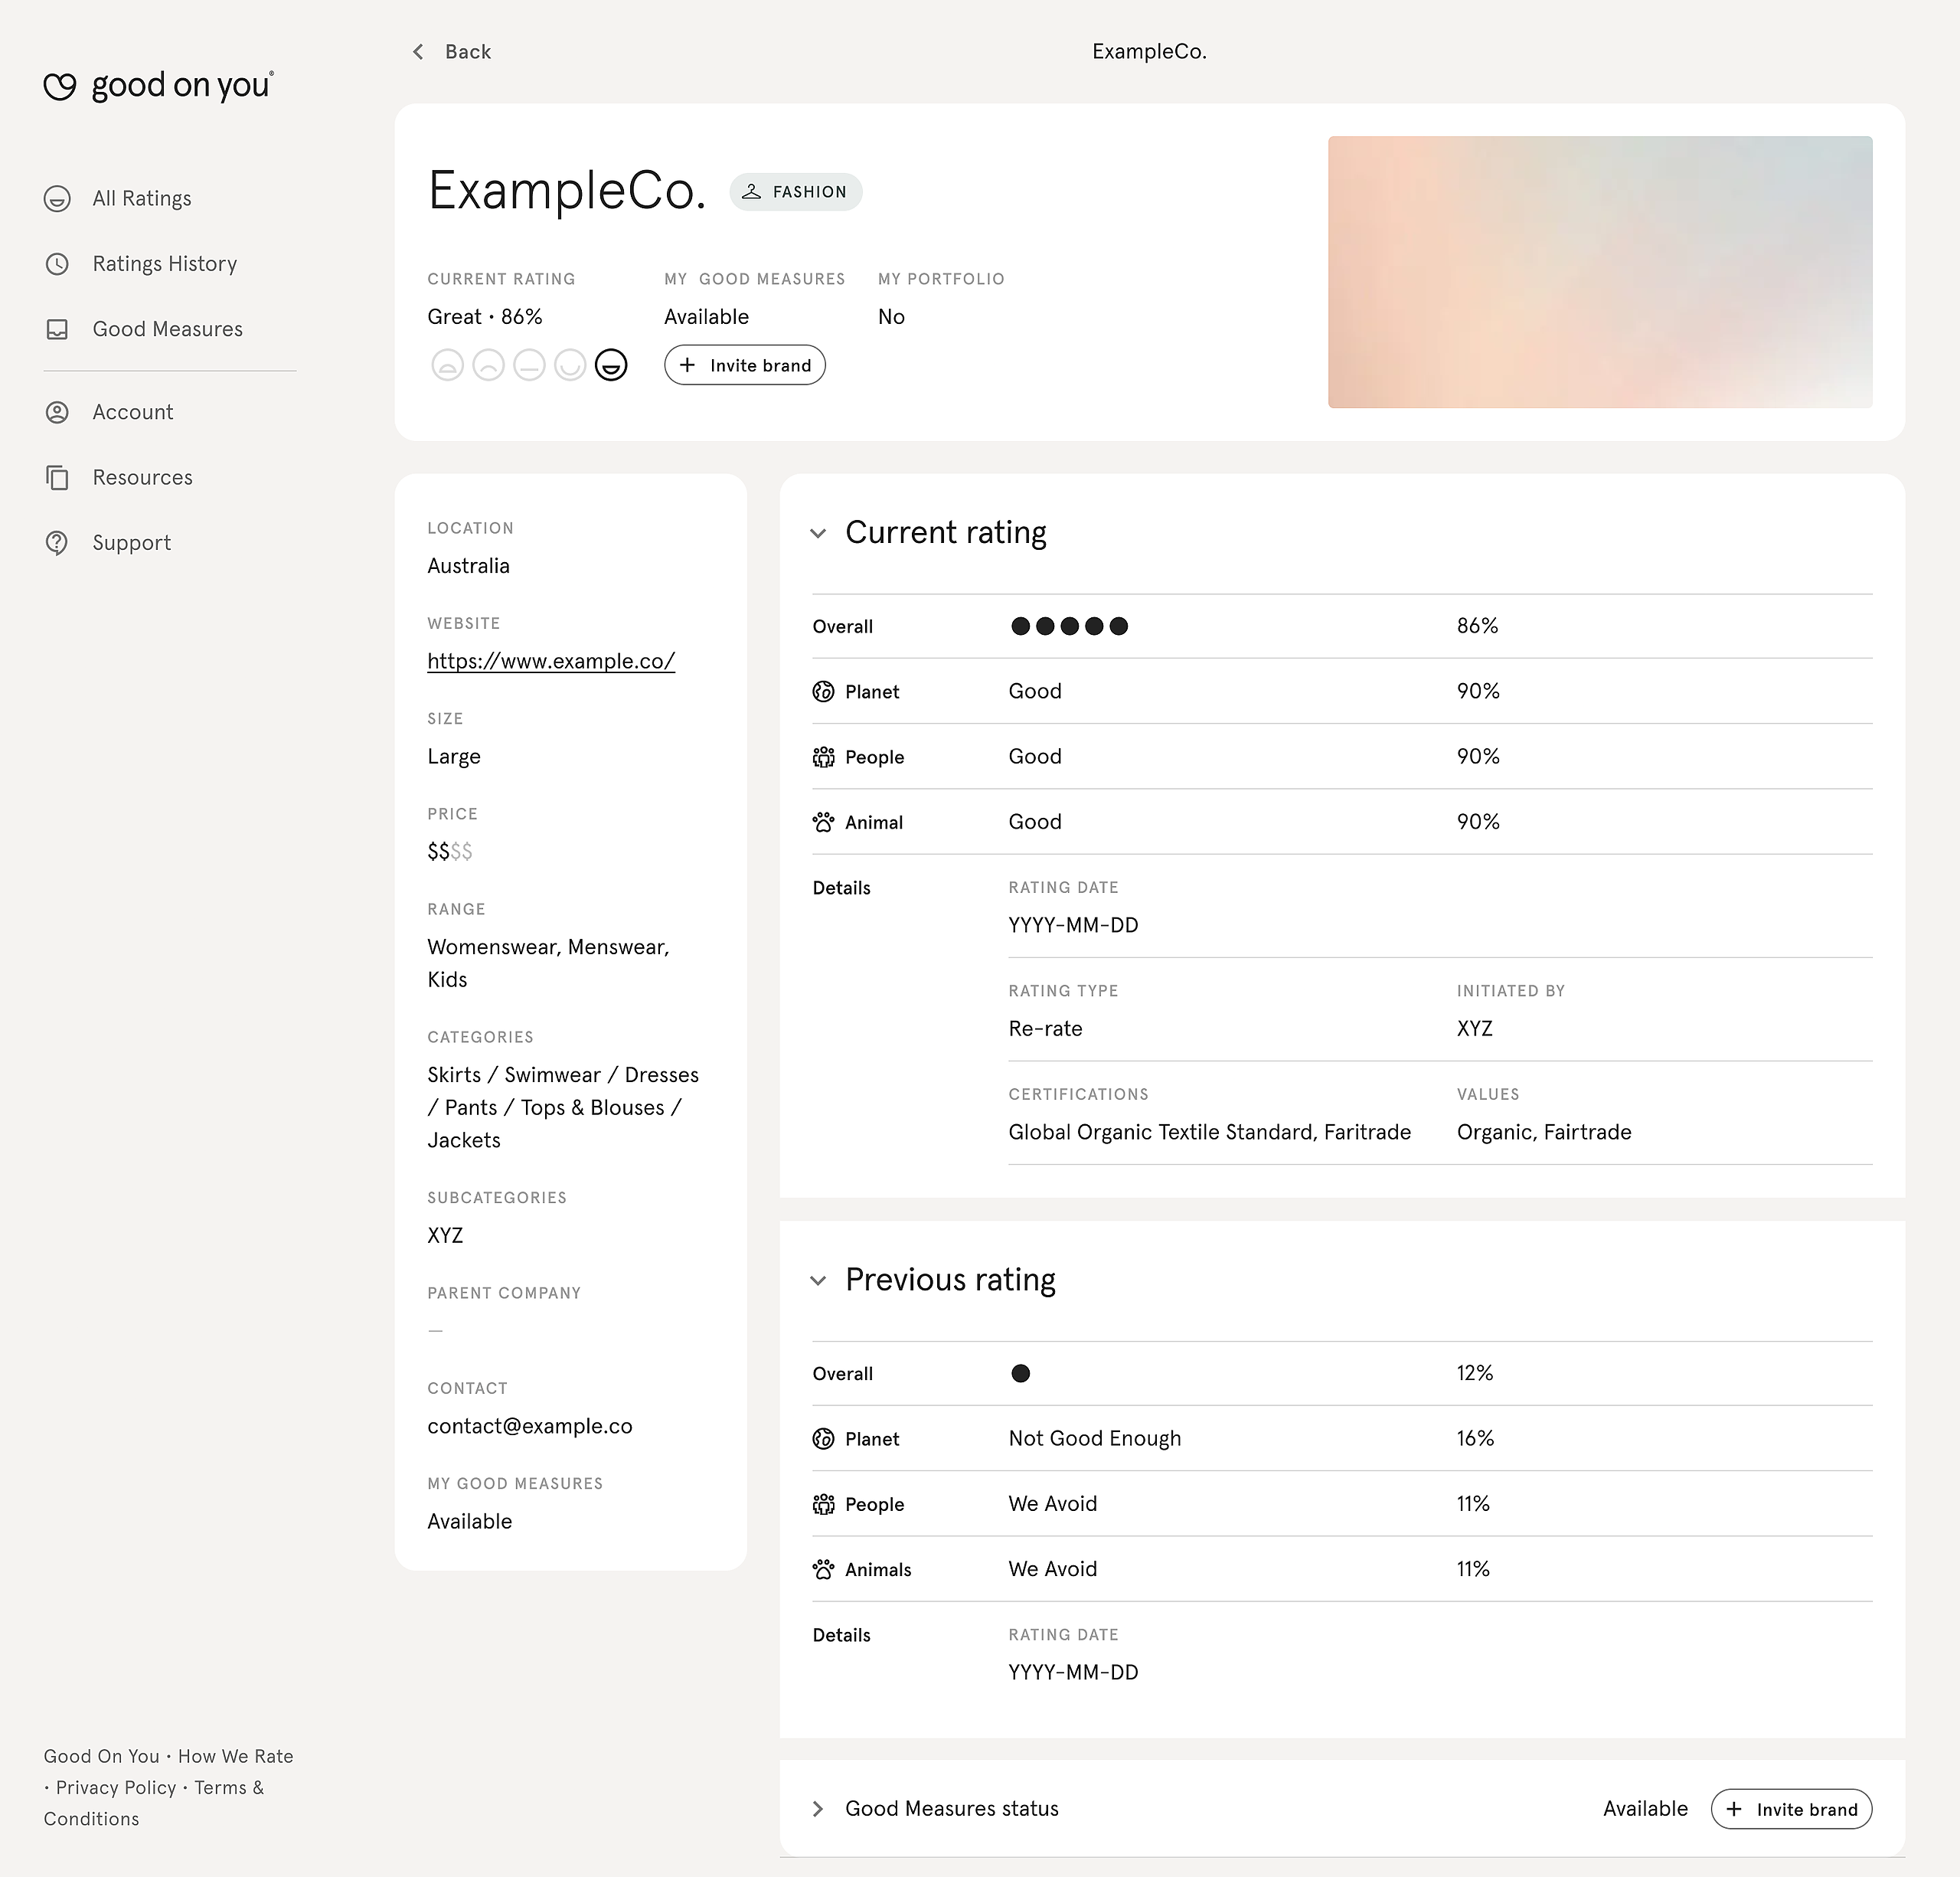
If you want to see more detailed information about a specific brand rating, simply click on the brand's name in the data table. You can also use the search function to find the brand in the main table. This will take you to that brand’s individual rating page, where you can view its full sustainability profile.
A brand's individual rating page offers insights into their rating over time. You can compare current and past ratings to assess sustainability progress, identify trends, and spot areas for improvement.
Tracking changes to ratings data
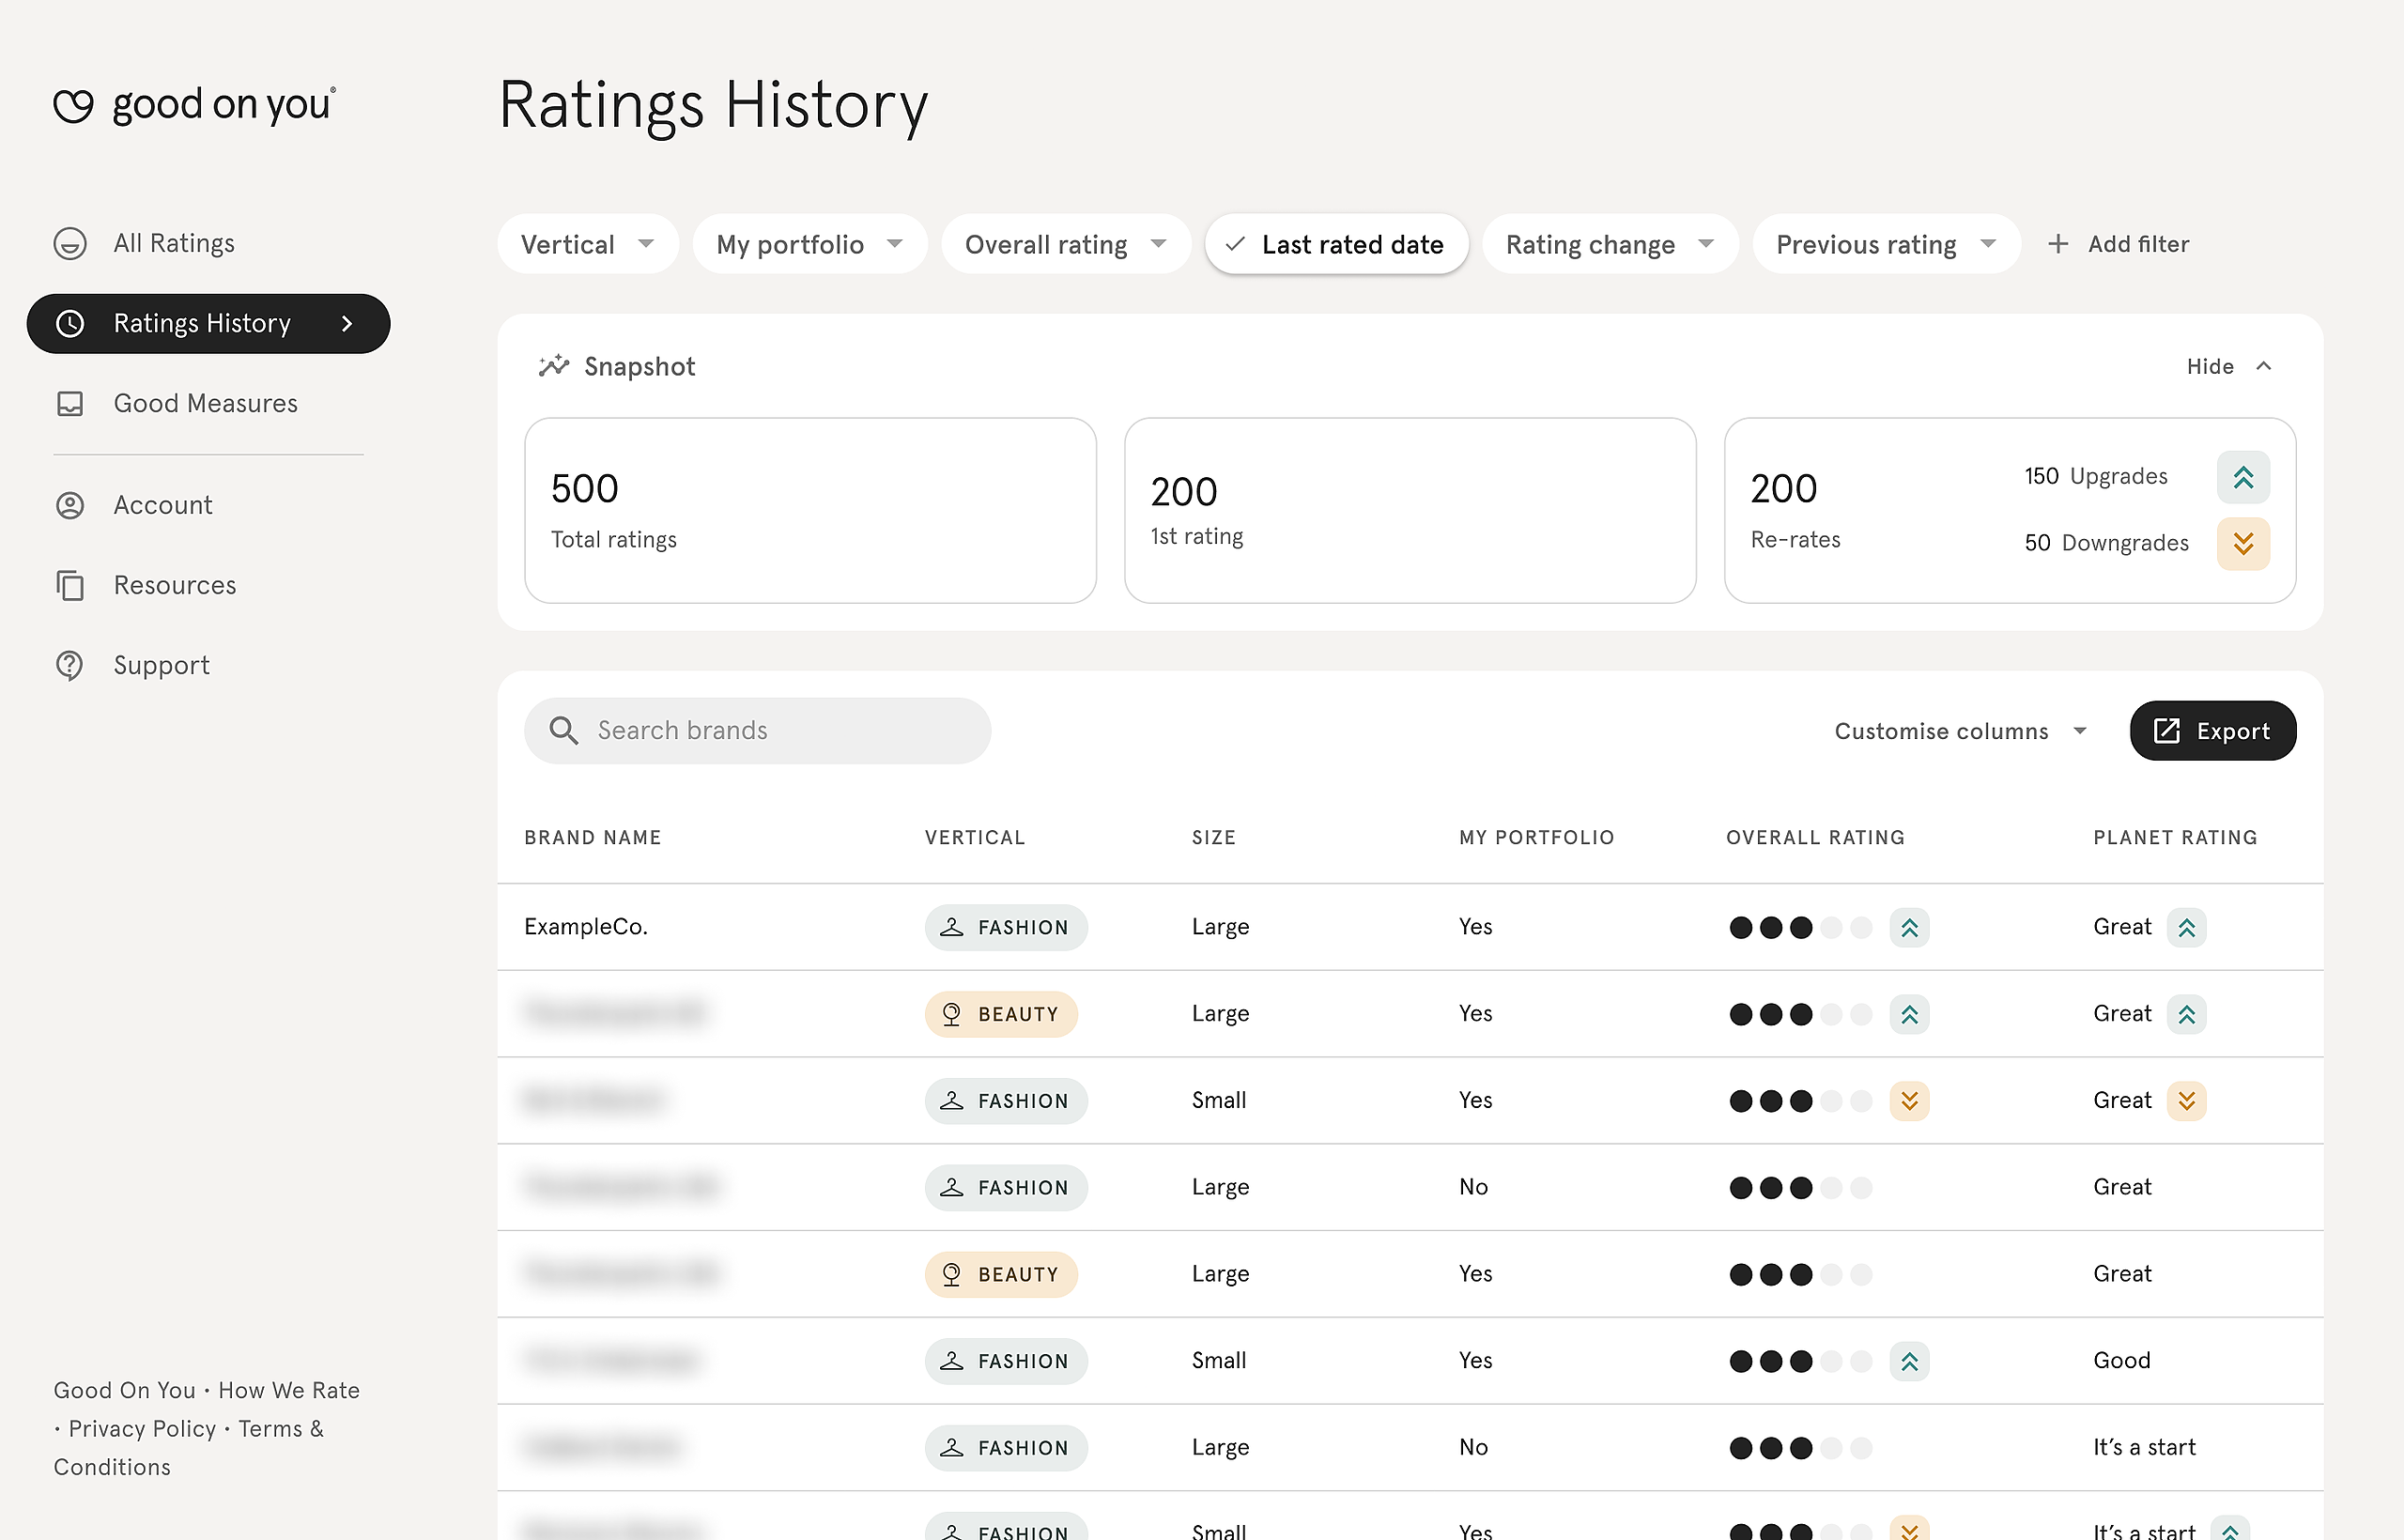
The Ratings History section allows you to compare the previous and current ratings for brands of interest all in one place. Key data includes:
- Last rated: Date the brand was last rated. By default, the table data in this section is filtered to show all ratings published in the last 30 days, but you can adjust this to any date range. For example, you might want to know how many re-rates upgraded their overall rating in 2024 vs 2025.
- Rating change: Shows if the brand’s current overall rating was upgraded, downgraded, or remained unchanged compared to the previous rating - or if it is a new rating.
- Previous ratings and scores: Shows the previous overall and theme-level rating and score for comparison with the current rating and score.
Inviting brands to Good Measures and tracking their progress
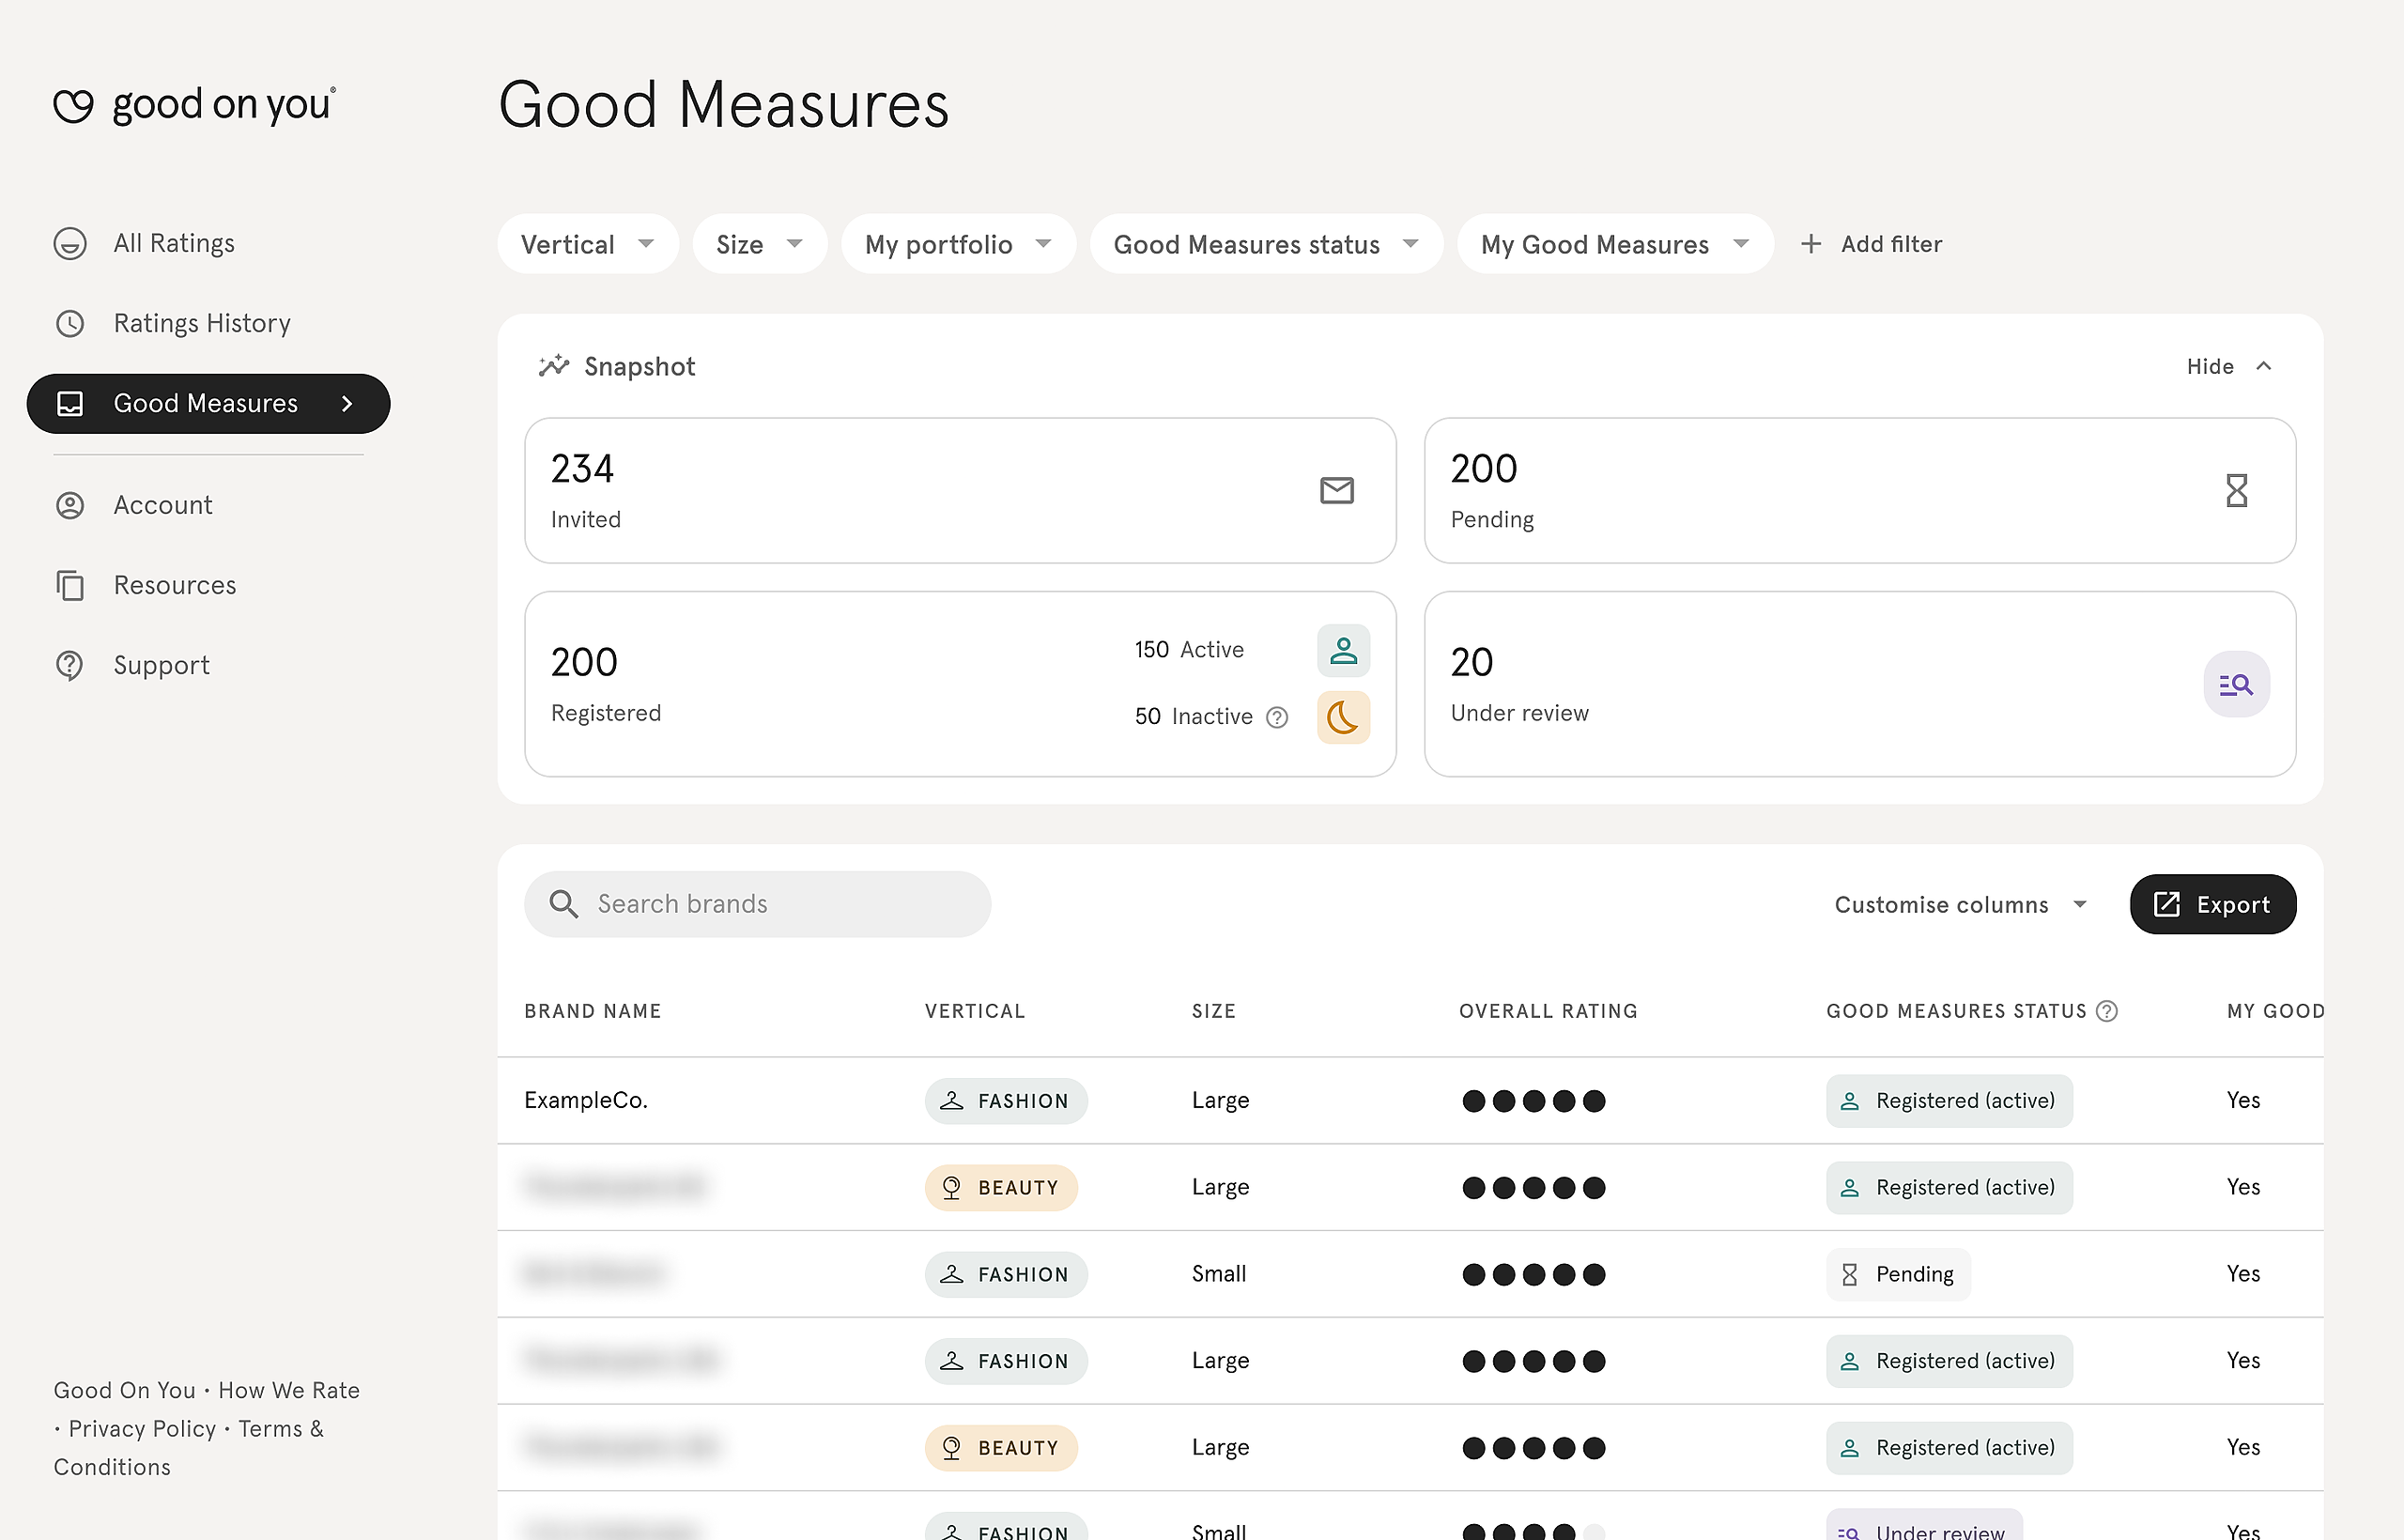
The Good Measures section is designed to help you (as an enterprise client) collaborate directly with brands to improve their sustainability performance. Here’s how to use it:
- Invite brands: You can invite brands to join Good Measures directly through the dashboard. This feature allows you to bring your partner brands into Good Measures, encouraging them to improve their sustainability practices. For detailed instructions, read the full guide on how to invite brands to Good Measures.
- Monitor submissions: Once brands are registered, you can track their submissions and see how they’re progressing with their sustainability performance. This gives you insights into how the brands you work with are making improvements.
Key filters found on the Good Measures section include:
- Brands you've invited to Good Measures ("My Good Measures")
- Current invite status ("Good Measures Status")
- Brands in your portfolio ("My Portfolio")
For any further assistance or to access Good Measures, please contact your account manager.
Exporting your view as a report
Once you've customised the table to your liking, you can export it as a report in CSV format.
- Click ‘Export CSV’: Look for the Export CSV button found at the top-right of the data table to export your current view.
- Open with Google Sheets or Excel:The CSV file will be downloaded to your computer, which you can open in Google Sheets, Excel, or Numbers.
Managing your account and inviting additional team members
It’s important to note that only the dashboard team owner can invite new users to the dashboard. Here’s what you need to know:
- Team owner responsibilities: The team owner can invite new users to the dashboard and manage user roles and permissions.
- Inviting team members: The team owner can invite new team members by navigating to the Account section and clicking the Invite Team Member button.
Note: If you're not the team owner and need to invite team members, please contact your team owner for assistance. If you need to make changes to the team owner, please contact your account manager.
Need More Help?
If you have any questions or run into issues, check out our Good On You Ratings Dashboard Guide or contact our support team at support@goodonyou.com.
For more detailed guidance on specific features:

